
Fourth Quarter 2024
Has Goldilocks Returned?
Bordeaux Wealth Advisors | February 10, 2025
2024 was in many ways a “Goldilocks” year characterized by positive economic growth, healthy labor markets, easing inflationary pressures, and increasingly supportive monetary policy. Investment returns were positive across most major asset classes. Heading into 2025, economic fundamentals could again offer a favorable backdrop for risk assets. That said, a few developments warrant attention: sentiment has turned more optimistic, valuations in key regions like the U.S. are elevated, and there remains uncertainty around when and what the new administration will implement from a policy perspective.
CLIMBING TO NEW HEIGHTS
Equity markets climbed to new heights in 2024, flourishing in a Goldilocks year – a “just right” environment characterized by positive economic growth, healthy labor markets, easing inflationary pressures, and increasingly supportive monetary policy. Returns were positive across most major asset classes, with fixed income +1% (U.S. Aggregate), hedge funds +10% (HFRI Fund Weighted [1]), and equities +17% (MSCI ACWI). The recent experience in markets has been remarkable, serving as a textbook example of the difficulties inherent in short-term forecasting. Following a -25% market decline in 2022, when analysts were predicting a recession, the momentum of the U.S. economy continues to surpass expectations, and global equities have now rallied nearly +60% from the lows set in 2022. As often happens, near-term predictions proved to be inaccurate. By adhering to a strategic asset allocation framework to navigate through volatility, investors have been rewarded with strong returns. Now, after back-to-back years with outsized equity gains, many investors are left questioning how likely we are to see an encore performance. Heading into 2025, the economic backdrop remains solid, with conditions resembling those of recent quarters. U.S. GDP growth is expected to be in the 2–3% range, inflation appears to be methodically moving toward the Fed’s comfort zone of 2–3%, and monetary policy is poised to ease further, with the Federal Reserve anticipated to cut rates 1–2 times this year. Furthermore, labor markets remain healthy, and consumer spending continues to support the economy and corporate earnings. To put it simply, the economic fundamentals should offer a positive backdrop for risk assets.
U.S. ECONOMIC FUNDAMENTALS REMAIN BETTER THAN AVERAGE
Current U.S. economic data compared to average economic data since 2000 is showing a robust economy in the United States [2]. That said, a few developments warrant close attention as we enter the new year. Notably, sentiment has turned much more optimistic. Following two years of outsized equity gains, market expectations have ratcheted upward. At the start of 2024, forecasts for the S&P 500 predicted low single-digit returns for the year, but a +25% rally has proven them wrong. Today, consensus estimates call for a ~10% return in 2025, while earnings growth projections have surged to 15% [3} – roughly double the historical average – pushing earnings per share estimates higher. These rosy forecasts have set in place expectations for increasing equity prices, though elevated risks are ever present.
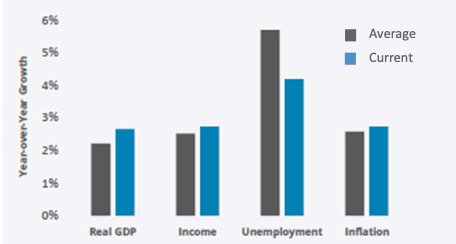
Source: FRED, Federal Reserve Bank of St. Louis
In addition to a sharp improvement in sentiment, valuations have continued to climb, especially in the U.S. The S&P 500 now trades slightly above 22x forward earnings [4], a level exceeded in only 4% of historical instances, placing multiples within the top decile of past observations. U.S. credit spreads, for investment-grade and high-yield bonds, are also tight, with spreads near 25-year lows. Tight spreads between investment-grade bonds and high-yield bonds mean investors are not getting paid much to take on the higher risk of default. Often it can be a sign that bond investors are overly optimistic and underestimating the risk of losses in high-yield bonds. While such pricing has thus far been supported by strong fundamentals – like accelerating earnings growth and elevated profit margins – valuations are nevertheless rich relative to history, which increases the probability for more muted returns going forward. Furthermore, for public equity, companies that miss on lofty expectations for earnings estimates, we are seeing greater downside risk to their current stock price. Given a near 33% weighting that just seven stocks (ie, the Magnificent 7) represent in the S&P 500 index, their forecasts are especially important to monitor. In fixed-income assets, investors are receiving relatively little “excess yield” versus U.S. Treasuries, leaving minimal cushion if defaults rise or spreads widen.
Lastly, the political landscape has begun to shift with the Trump administration’s return to office. With a Republican-controlled Congress, key components of President Trump’s policy agenda – including tax cuts, deregulation, establishment of the Department of Government Efficiency, and tariffs – are taking center stage. A reduction in the corporate tax rate from 21% to 15% (among the lowest of the G20 countries) could provide a boost to earnings, potentially increasing S&P 500 EPS by ~5%. Deregulation could further stimulate M&A activity and capital investment. However, trade policies – including broad tariffs or targeted measures against China and other regions – introduce greater uncertainty. The interplay between pro-growth domestic policies and more disruptive trade measures will be critical to monitor. For example, a combination of economic stimulus and rising inflation could prompt the Fed to pause rate cuts or even resume hikes, introducing additional volatility. Interestingly, since the Fed began easing policy in September of 2024, the U.S. 10-year Treasury yield has risen by ~1%, potentially reflecting the risk that inflation could remain stubborn or that growth may accelerate relative to forecasts. While President Trump’s prior term in office offers some semblance of a “playbook,” the fiscal landscape looks different today as the U.S. is running a deficit-to-GDP ratio of over 6% (compared to 3% in 2017) – leaving potentially limited appetite for fiscal firepower.
OUTLOOK FOR PUBLIC MARKETS: POSITIVE, THOUGH EQUITY RETURNS MAY MODERATE
There is potential to experience a frothy environment for equities in 2025, reminiscent of the second half of the 1990s. Today’s AI-driven enthusiasm mirrors the transformative nature of the internet boom, as this exciting technology may enhance productivity and reshape industries. However, the recent news regarding the Chinese AI company DeepSeek served as a reminder that technology can change quickly, and new companies and ideas can quickly disrupt the status quo.
Similarly, the global economic landscape remains bifurcated, a dynamic that also characterized the late 1990s, with the U.S. maintaining strength while Europe and parts of emerging markets, such as China, lag behind. While the parallels to the dotcom era are intriguing, and the themes of easing monetary policy, a growing economy, and solid labor markets are in place to potentially propel risk assets higher, history reminds us that bull markets often produce more modest returns in their third year, a pattern that may suggest a more measured outlook for 2025.
The range of potential outcomes for the year ahead is very uncertain. In one scenario we are calling “Goldilocks Returned,” where economic growth remains robust, corporate tax cuts are passed, and tariffs are targeted and modest — the S&P 500 could rise much higher in 2025 under these conditions. However, in another plausible scenario we will call “Muddle Along,” the U.S. economy could experience more muted economic growth, a deceleration in consumer spending, stalled tax cuts, and broad tariffs — all of which might disrupt the recent path of equity markets and deliver flat to even negative returns in the year. While there are many plausible paths that could play out (ranging from a recession to bubble-like conditions), the point is to highlight two reasonable outcomes that support why returns may moderate in the year ahead.
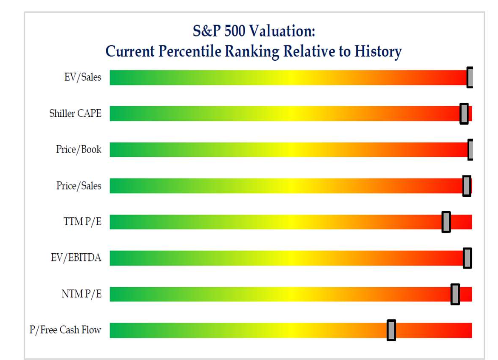
Source: Strategas Research
Additionally, there is much on the horizon that could go right and justify current equity market prices; however, we are taking note of the growing number of indices, benchmarks and metrics that are showing a stretch toward (or well past) historical levels that illustrate extreme valuations [5]. In some instances, it could be argued that circumstances justify these excess readings, but it’s worth pointing out that the drumbeat of alarm has steadily risen in recent months and quarters.
PRIVATE MARKETS: GREEN SHOOTS RISING
Both buyouts and venture indices delivered positive results in 2024 (+7% and +3% YTD through Q3, respectively [6]), as green shoots appear to be popping up for private market investors. Encouragingly, activity has perked up after the muted environment in 2022 and 2023. Deal activity and exits have increased, with data from Pitchbook (through Q3 2024) indicating that U.S. buyouts & growth equity deal value has risen 23% year-over-year and is on track for the third highest total ever. Venture deal counts also suggest the environment may have leveled out with encouraging dynamics emerging from an AI-led innovation cycle.
Importantly, the outlook for liquidity appears to be improving. Several high-profile venture-backed businesses have recently been in the news as reportedly exploring IPOs, and with the anticipation of a potentially less scrutinized M&A environment pulling strategic acquirers back into the mix, there should be additional avenues for GPs to exit investments in the coming quarters, suggesting more distributions may be on the horizon.
We maintain a positive outlook for the private equity and venture capital asset class and believe that private markets can offer compelling long-term return opportunities for investors who can prudently maximize illiquid investments within their portfolios. Over the long run, private equity has meaningfully outperformed public equity for structural, operational, and strategic reasons. Notably, the advantages over public markets stem from an“illiquidity premium” or compensation for locking up your capital (“structural”), the ability to improve and scale a business through control of ownership (“operational”), and the fact that many of these smaller companies exist in less efficient segments of the market which are often more fragmented and have lower valuations (“strategic”). Together, these factors have historically helped deliver returns of over +6% above public markets over rolling 10-year periods, on average [7]
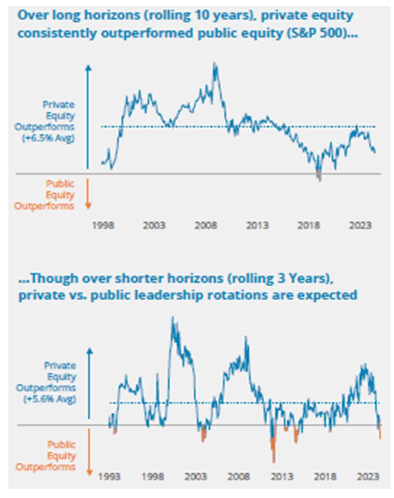
Source: Cambridge Associates and eVestment
That said, we recognize that investors with less seasoned private investments may be comparing their allocations against the exceptional public market returns of recent years. A closer review of shorter time periods shows that the relative performance between these two asset classes ebbs and flows. In the past we have experienced several instances over shorter horizons where private equity lags public equity, especially in periods of outsized public market performance. This is not out of the norm and is consistent with what has happened during the past two years. Looking forward, investors should temper the expectation that public equity markets will generate compound returns above +20% per annum (as experienced in both 2023 and 2024). We are seeing improving results from private markets and encourage investors to remain disciplined with their commitment to build toward and maintain strategic private equity targets.
SUMMARY
Reflecting on an extraordinary period for equities, the importance of discipline and strategic asset allocation remains clear. By maintaining exposure to opportunities across a diverse range of asset classes and regions, and by thoughtfully rebalancing portfolios to keep exposures in line with your long-term targets, clients can remain well-positioned to navigate an evolving market environment with confidence. We look forward to meeting with you in the coming months to discuss your portfolio goals and strategic asset allocation. On behalf of the entire BWA team, we wish you a happy, healthy, and prosperous 2025.
Endnotes
[1] Performance represents HFRI Fund Weighted Composite Index as of 12/31/2024.
[2] Data from FRED, Federal Reserve Bank of St. Louis. Real GDP as of Q3 2024. Income represented by Real Disposable Personal Income as of October 2024. Unemployment Rate as of December 2024. Inflation represented by Consumer Price Index for All Urban Consumers: All Items in U.S. City Average as of November 2024.
[3] Data sourced from Bloomberg and FactSet.
[4] S&P 500 Forward P/E Ratio data sourced from Bloomberg. Investment Grade Credit Spreads are ICE BofA U.S. Corporate Index Option-Adjusted Spread and sourced from FRED, Federal Reserve Bank of St. Louis.
[5] Valuation metrics for the S&P 500 from Strategas Research.
[6[ Private Equity returns represented by Cambridge Associates U.S. benchmarks for Buyouts and Venture as of 9/30/24.
[7] Returns from Cambridge Associates and eVestment. Private Equity represented by a blend of 70% to U.S. Buyout funds and 30% to U.S. Venture Capital / Growth Equity funds, as defined by Cambridge Associates.